Sultan Lab for Mental Health Informatics
Columbia University Irving Medical Center
Home → Research → Youth Psychiatric Medication Statistics
|
Youth psychiatric medication statistics, sourced: stimulant dispensing to U.S. children ages 3–17 has been flat since its 2011 peak (5.9% then, 5.3% in 2023); antipsychotics fell from 1.3% to 1.1% over 2006–2023; SSRIs rose from 1.5% to 3.6%. In 2022, 53.6% of children with current ADHD took medication, down from 62.0% in 2016. In 2024, 60.6% of adolescents with past-year major depression received treatment, up from 40.0% in 2021. 72% of U.S. counties have no child and adolescent psychiatrist (April 2024). Every number on this page carries its data years and source. |
Youth Psychiatric Medication Statistics (2026): Every Number Sourced
By Ryan S. Sultan, MD, Assistant Professor of Clinical Psychiatry, Columbia University Irving Medical Center
Double Board-Certified in Adult Psychiatry & Child/Adolescent Psychiatry
Published:
This page is a reference sheet. Journalists and bloggers writing about kids and psychiatric medication keep re-deriving the same numbers from press releases, and the press releases routinely drop the two things that matter: the data years and the study design. So here's the compilation I wish I could hand every reporter who calls. One number up front to set the frame: in national all-payer dispensing data from 2006 through 2023, stimulant prescribing to children ages 3–17 peaked in 2011 at 5.9% and sat at 5.3% in 2023 (ASPE Data Point, HHS, April 2025; IQVIA).
Every statistic below carries its data years and its primary source inline. If a number isn't here, I couldn't verify it, and you probably shouldn't print it either. For the narrative version written for parents, see Which Kids Are Overmedicated? What Prescribing Data Show.
|
Key numbers
|
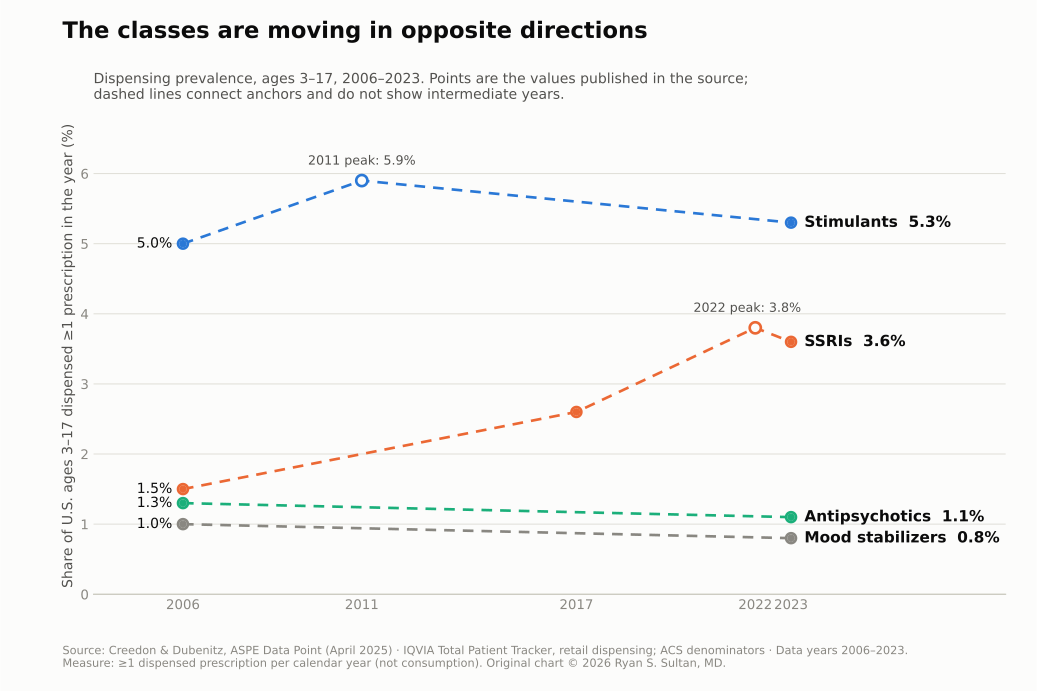
Prescribing trends by class: only one class is growing
All rows below measure dispensing (at least one filled prescription), which will run higher than ongoing treatment and says nothing about pills actually taken.
| Statistic | Data years | Source & design |
|---|---|---|
| Stimulants: 5.0% of ages 3–17 (2006) → 5.9% peak (2011) → ~5.3% (2023); flat since 2011 | 2006–2023 | ASPE Data Point (HHS, April 2025); IQVIA all-payer dispensing; descriptive |
| SSRIs: 1.5% → 3.6% of ages 3–17, peaking at 3.8% in 2022 | 2006–2023 | Same |
| Antipsychotics: 1.3% → 1.1% of ages 3–17 (while adults rose 1.9% → 3.0%) | 2006–2023 | Same |
| Antidepressant dispensing to ages 12–25 rose 66.3% (2,575.9 → 4,284.8 per 100,000 people per month) | 2016–2022 | Chua et al., Pediatrics 2024; IQVIA; interrupted time series |
| After March 2020, that dispensing rate grew 63.5% faster than before; among girls 12–17 it grew 129.6% faster, while dispensing to boys 12–17 declined | 2016–2022 | Same; associational, not causal |
ADHD: diagnosis has outrun treatment, and the gap is widening
In our 2018 study of 2008 national dispensing data, we found stimulant treatment in school-age children (ages 6–12) running at 4.6% against an ADHD prevalence near 8.6% (Sultan et al., J Child Adolesc Psychopharmacol 2018). While public debate assumed excess, those figures described a treatment gap even then. The newer, nationally representative survey data say the gap has grown.
| Statistic | Data years | Source & design |
|---|---|---|
| 11.4% of children ages 3–17 ever diagnosed with ADHD; 10.5% current; 58.1% of current cases rated moderate or severe | 2022 | NSCH parent survey (Danielson et al., 2024) |
| 53.6% of children with current ADHD taking ADHD medication (down from 62.0% in 2016); 30.1% receiving no treatment of any kind | 2022 vs 2016 | NSCH; not severity-adjusted |
| Ever diagnosed, ages 5–17: boys 14.5% vs girls 8.0% | 2020–2022 | NHIS (NCHS Data Brief 499); diagnosis, not true prevalence |
| After the October 2022 Adderall shortage, prior Adderall-IR users were 1.2 percentage points (95% CI 1.0–1.3) more likely to have no stimulant fill at all; the effect was largest for children on Medicaid | 2020–2023 | He & Chua, Pediatrics 2025; IQVIA; difference-in-differences |
| Stimulant dispensing 4.6% (ages 6–12) vs ADHD prevalence ~8.6%; historical baseline | 2008 | Sultan et al., J Child Adolesc Psychopharmacol 2018; IMS all-payer; descriptive |
| Adolescent nonmedical use of prescription stimulants declined | 2009–2022 | Monitoring the Future (McCabe et al., 2025); self-report |
Depression: treatment reach improved, and four in ten teens still get nothing
The nationally representative NSDUH survey was redesigned in 2022, so read the 2021-to-2024 change as a direction of travel; the redesign limits precise year-over-year comparison.
| Statistic | Data years | Source & design |
|---|---|---|
| 17.7% of adolescents 12–17 had a past-year major depressive episode (girls 26.0%, boys 9.8%) | 2022–2024 pooled | NSDUH; self-report survey |
| Share of adolescents with a major depressive episode who received treatment: 40.0% (2021) → 50.7% (2023) → 60.6% (2024) | 2021–2024 | NSDUH / Healthy People 2030; survey trend across the 2022 redesign |
| Treatment by race, 2024: 67.7% of White adolescents with major depression treated vs 53.2% Hispanic vs 44.7% Black | 2024 | NSDUH; adjusted odds for Black adolescents ~0.4 |
| Odds of depression medication vs White adolescents: Black aOR 0.26, Hispanic aOR 0.53 | 2022 | Tan et al., 2025 (NSDUH); adjusted cross-section, one year |
| Among Medicaid youth ages 9–24 starting an antidepressant for depression: acute-phase follow-up standards met 49.6%; continuation-phase 26.5% | 2016–2019 | Fontanella et al., JAACAP; HEDIS-based Medicaid cohort |
Antipsychotics: the concerns center on sequencing and monitoring
In our 2019 study of 187,563 commercially insured youths newly diagnosed with ADHD, we found 2.6% (95% CI 2.5–2.7) filled an antipsychotic within one year (Sultan et al., JAMA Network Open 2019; MarketScan claims, 2010–2015). Notably, the journal published a correction: the accurate figure is 2.6%, superseding the originally published 2.3%. Commercial claims only, so don't generalize to Medicaid, where antipsychotic use runs higher. For the full breakdown, see the antipsychotic overuse page.
| Statistic | Data years | Source & design |
|---|---|---|
| 2.6% (95% CI 2.5–2.7) of youths newly diagnosed with ADHD initiated an antipsychotic within one year; highest in ages 3–5, at 4.3% | 2010–2015 | Sultan et al., JAMA Network Open 2019; MarketScan commercial cohort, N=187,563 |
| Of those initiators: 47.9% (95% CI 46.5–49.3) had no stimulant fill before the antipsychotic; only 8.4% had tried both stimulant classes; ~47% had no FDA-approved or evidence-supported diagnosis | 2010–2015 | Same; claims can't see undocumented aggression |
| 44–47% of youth antipsychotic prescriptions were off-label; 51% of the off-label use was tied to ADHD | 2014–2018 | Candon et al., 2021; Philadelphia Medicaid; descriptive, one region |
| The median state got both recommended metabolic tests (glucose and cholesterol) done for 35.2% of Medicaid children with 2+ antipsychotic prescriptions in the year | 2023 | CMS Child Core Set, FFY2024 quality measure; "any test in the year" bar |
| Adherence to the full guideline monitoring schedule: glucose 6.5%, cholesterol 0.8% | 2010–2018 | Sanyal et al., 2024; Texas Medicaid cohort; stricter bar than the CMS measure |
Although some off-label use is evidence-supported (risperidone, for example, has trial evidence for severe aggression after adequate stimulant trials), the sequencing figures above raise concerns regarding how these medications are being started.
Polypharmacy nearly doubled, and preschool prescriptions run long
| Statistic | Data years | Source & design |
|---|---|---|
| Any psychotropic use among ages 6–24 rose from 5.3% to 8.3%; concurrent use of multiple psychotropics from 1.8% to 3.3% | 2001–March 2020 | Meng et al., JAACAP 2025; NHANES 30-day self-report; series stops at pandemic onset |
| 26% of young psychotropic users had combinations flagged for potential major drug–drug interactions | 2001–March 2020 | Same; "potential" interactions, not observed harms |
| Medicaid youth psychotropic polypharmacy rose 4.2% → 4.6%; children in foster care had roughly 3x the adjusted odds | 2015–2020 | Chiang et al., 2024; Maryland Medicaid; adjusted trend, one state |
| Preschoolers started on antipsychotics stayed on them a mean of 2.6 years; 27% stayed on more than 4 years; only 42% had any metabolic monitoring | 2012–2017 | Lohr et al., 2022; Kentucky Medicaid cohort, one state |
Treatment effects: medicated periods look better, and the design labels matter
The observational rows compare a person with themselves on and off medication, a design that removes stable confounding (genetics, family) while leaving time-varying confounding in place. None of them is a randomized trial, and two of the three are Swedish; the two Swedish studies are broadly consistent with each other, with the accidental-injury estimate the design-dependent exception. These findings belong to their authors; in our 2025 JAMA Psychiatry editorial we argued about what the Li results mean for U.S. practice, but the numbers are Li's.
| Statistic | Data years | Source & design |
|---|---|---|
| During medicated periods, ADHD patients had fewer events: self-harm IRR 0.77–0.85; unintentional injury 0.87–0.93; traffic crashes 0.71–0.87; crime 0.73–0.84 (N=247,420, ages 4–64) | 2006–2020, Sweden | Li et al., JAMA Psychiatry 2025; within-individual self-controlled case series; observational |
| First-event IRRs on medication: suicidal behaviour 0.83; substance misuse 0.85; transport accidents 0.88; criminality 0.87; accidental injury 0.98 (null) | 2007–2020, Sweden | Zhang et al., BMJ 2025; target-trial emulation; the injury result is design-dependent |
| Substance-related events roughly one-third lower during medicated months (men OR 0.65, women 0.69) | 2005–2014, U.S. | Quinn et al., Am J Psychiatry 2017; within-individual claims analysis |
| Medication beat intensive behavioral treatment for core ADHD symptoms at 14 months | mid-1990s | MTA Cooperative Group; randomized trial; long-term follow-up subgroups self-selected |
| Adolescent depression, 12-week response: combination 71.0%; fluoxetine 60.6%; CBT 43.2%; placebo 34.8% | 2000–2003 | TADS; randomized trial |
| Pediatric antidepressants: NNT 3 for anxiety, 6 for OCD, 10 for depression; NNH 143 for suicidal ideation/attempt; 0 completed suicides across 27 trials | trials through 2007 | Bridge et al., 2007; meta-analysis of 27 randomized trials; trial populations |
| Adolescents in remission randomized off fluoxetine: 69.2% relapsed within 6 months vs 42.0% who continued (ages 7–18, n=102) | published 2008 | Emslie et al.; discontinuation randomized trial; small |
| Consistent-medication subgroup of the MTA cohort: adult height ~2.55 cm shorter (associated, not established as causal; subgroups self-selected) | 1990s–2010s | MTA observational follow-up |
Workforce and training: the system prescribing these drugs is understaffed and undertrained
Little is known about stopping these medications once they're started; the final two rows quantify that gap.
| Statistic | Data years | Source & design |
|---|---|---|
| 15 child and adolescent psychiatrists per 100,000 children; 11,422 total; 72% of U.S. counties have none | April 2024 | AACAP workforce data; practice-location based |
| Primary care clinicians alone delivered 34.8% of outpatient child mental health care, and medicated more often than psychiatrists (70.2% vs 63.0% of visits) | 2008–2011 | Anderson et al., 2015; MEPS; dated |
| ~66% of pediatricians reported inadequate training to treat child mental health problems, unchanged from 2004 to 2013 | 2004, 2013 | AAP Periodic Surveys (Horwitz et al., 2015); no newer wave exists |
| Pediatrics residencies first required a dedicated 4-week mental health rotation effective July 2025 | effective July 2025 | ACGME program requirements |
| The word "deprescribing" appears 0 times in ACGME program requirements for pediatrics, psychiatry, or child and adolescent psychiatry; 0 of 46 published deprescribing curricula in medicine target children | current / 2024 | ACGME documents; Chow et al., 2025; verified by full-text search |
| 0 formal clinical practice guidelines exist for stopping psychiatric medications in young people, out of 1,390 records screened | 2015–2025 | Fargier et al., 2026 systematic review |
How to read these numbers: three distinctions that keep getting flattened
Dispensing vs use vs survey report. The ASPE/IQVIA and Chua numbers count filled prescriptions (at least one fill in the period), which overstates ongoing treatment and says nothing about pills actually taken. NHANES and NSDUH numbers are self- or parent-report surveys, with their own biases. NSCH counts parent-reported diagnoses. These three measurement types will not match each other, and quoting them interchangeably produces fake trends.
Data years lag publication years. A 2025 paper can describe 2010–2015 claims. The Sultan 2019 antipsychotic figures are 2010–2015 commercial claims; the NHANES polypharmacy series stops in March 2020; the MEPS workforce numbers are 2008–2011. When you quote a figure, give its data years.
Observational evidence cannot establish causal relationships, and a rising curve has several explanations. While the within-individual IRRs above are strong observational evidence, they fall short of trial results. Further, a rising prescription curve tracks rising diagnosed illness and a deliberate access push as much as it tracks prescriber behavior; the same datasets show large groups of diagnosed kids getting nothing at all. Accordingly, both patterns warrant vigilance: the sequencing and monitoring problems documented above, and the larger group of diagnosed young people receiving no treatment.
How to cite this page
|
Suggested citation: Every statistic on this page is cited inline to its primary study with its data years. Journalists are welcome to cite the primary sources directly (preferred for single statistics) or this compilation (for the assembled picture). The trend chart above is free to republish with its source note. For interview requests or fact-checking: contact. |
About the author. I'm a child and adolescent psychiatrist and Assistant Professor of Clinical Psychiatry at Columbia University Irving Medical Center, where I direct the Sultan Lab for Mental Health Informatics. I wrote the 2018 national study of psychotropic prescribing to young people (J Child Adolesc Psychopharmacol, 2008 data), the 2019 JAMA Network Open study of antipsychotic prescribing in 187,563 youths with ADHD, and a 2025 JAMA Psychiatry editorial on ADHD medication and real-world outcomes. I treat children, adolescents, and adults in New York City.
Related reading on this site
- Psychiatric Deprescribing in 2026: The Sequencing Problem: the 2026 federal deprescribing push, and why medication order matters more than volume (as discussed in AAMCNews)
- Which Kids Are Overmedicated? What Prescribing Data Show: the narrative version for parents, with the questions to ask at your child's next appointment
- Is ADHD Overdiagnosed and Overmedicated?: what the diagnosis and treatment data support
- Pediatric Antipsychotic Overuse: the full technical breakdown of the 2019 JAMA Network Open cohort
- National Patterns of Pediatric Psychotropic Prescribing: the 2018 study of stimulants, antidepressants, and antipsychotics
|
Medical disclaimer: This page is for education only and is not medical advice. It does not create a doctor–patient relationship, and it can't account for your child's specific situation. Never start, stop, or change a medication without consulting your child's clinician; abrupt discontinuation of psychiatric medications can be harmful. If you or your child are experiencing a mental health emergency, call or text 988 (Suicide & Crisis Lifeline) or go to the nearest emergency room. |